Image Details
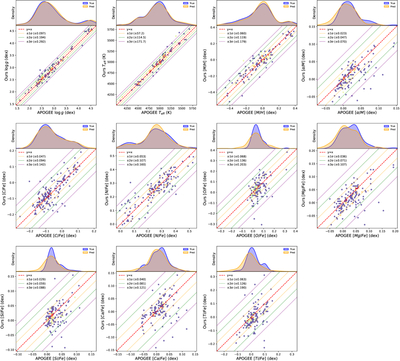
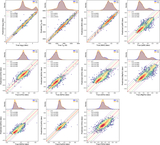
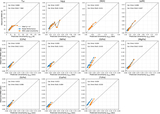
Caption: Figure 11.
Comparison of the 11 stellar labels derived from our low-resolution XP spectra against the high-resolution APOGEE ASPCAP pipeline for 170 common stars in the unseen application set. The red dashed line indicates the identity relation (y = x). The dotted lines (orange, green, and purple) represent the ±1σ, ±2σ, and ±3σ dispersion intervals derived from the residuals, respectively. The top panels show the marginal probability density distributions of ASPCAP’s parameters (blue) and ours (orange), demonstrating the consistency of the global distributions.
Other Images in This Article
Show More
Copyright and Terms & Conditions
© 2026. The Author(s). Published by the American Astronomical Society.
Copyright ©
2026 Astronomy Image Explorer. All Rights Reserved.