Image Details
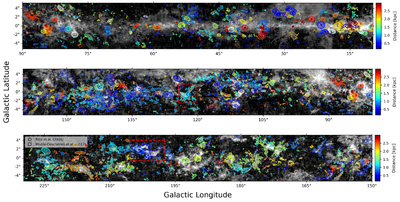
Caption: Figure 12.
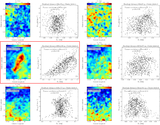
The l–b distribution of molecular clouds cataloged in this work. The background is the integrated-intensity map of 12CO emission. Colored contours outline the boundaries of the clouds identified in this study, where the color scale indicates the distance to each cloud. The top, middle, and bottom panels show clouds in the Galactic longitude ranges of 9﹩\mathop{.}\limits^{\unicode{x000b0}}﹩75–90°, 80°–160°, and 150°–229﹩\mathop{.}\limits^{\unicode{x000b0}}﹩75, respectively. For comparison, previously cataloged clouds from T. S. Rice et al. (2016) and M.-A. Miville-Deschênes et al. (2017) (both based on kinematic distances) are overplotted as circles and squares, respectively, with ellipses representing their angular sizes and position angles. For these comparison catalogs, clouds with kinematic distances ≤3 kpc are shown in color following the same distance scale as the cloud contours, while those with kinematic distances >3 kpc are shown in white.
Other Images in This Article
Show More
Copyright and Terms & Conditions
© 2026. The Author(s). Published by the American Astronomical Society.