Image Details
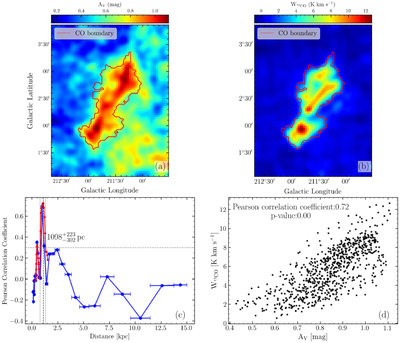
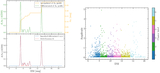
Caption: Figure 6.
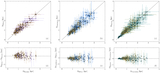
Distance of MWISP G211.613+02.405+007.49 based on the AV versus WCO Pearson correlation from distance-sliced dust map. Panels (a), (b), and (d) are identical to those in Figure 3 and are described in detail in its caption. (c) The variation of the correlation coefficient at different distance slices. The blue line represents the correlation variation calculated with a 20% distance interval, while the red line shows a finer 5% interval. The black solid line indicates the estimated distance and the black dashed lines depict the uncertainty of the cloud distance.
Other Images in This Article
Show More
Copyright and Terms & Conditions
© 2026. The Author(s). Published by the American Astronomical Society.
Copyright ©
2026 Astronomy Image Explorer. All Rights Reserved.