Image Details
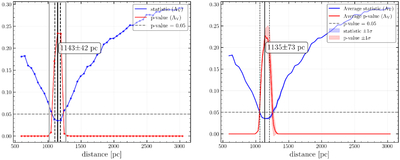
Caption: Figure 2.
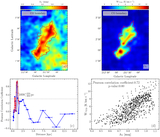
Left panel: KS test statistic (blue) and corresponding p-value (red) as functions of distance in the initial optimization. The convergence of a minimum KS statistic and a maximum p-value identifies a distance (black) with uncertainty, corresponding to a 3σ confidence region (gray box) used to constrain subsequent parameter refinement. Right panel: Ensemble analysis of 100 independent Monte Carlo repetitions performed within the constrained parameter range. Average KS statistic (blue curve) and p-value (red curve) profiles are shown with 1σ uncertainty (shaded). The final distance is indicated by the solid black vertical line, with its uncertainty range marked by the dashed black vertical lines.
Other Images in This Article
Show More
Copyright and Terms & Conditions
© 2026. The Author(s). Published by the American Astronomical Society.