Image Details
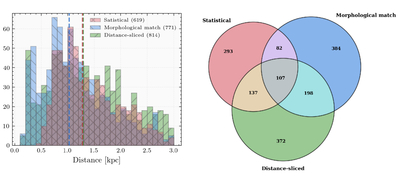
Caption: Figure 7.
Histogram of distances (left) and Venn diagram (right) for cataloged molecular clouds measured by three independent methods. Colors distinguish the methods: statistical (red), morphological matching (blue), and distance sliced (green). Vertical dashed lines in the histogram indicate the median distance for each method, and numbers in the Venn diagram segments show the count of clouds identified by the corresponding combination of methods.
Other Images in This Article
Show More
Copyright and Terms & Conditions
© 2026. The Author(s). Published by the American Astronomical Society.
Copyright ©
2026 Astronomy Image Explorer. All Rights Reserved.