Image Details
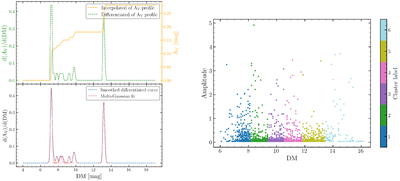
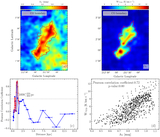
Caption: Figure 4.
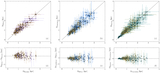
Left panel: The extinction–distance modulus relation along the example sight line. The extinction profile is interpolated (orange), differentiated (green), smoothed (blue), and fitted with a multi-Gaussian model (red). Right panel: K-means clustering results. Points represent the fitted Gaussian components, colored by cluster label.
Other Images in This Article
Show More
Copyright and Terms & Conditions
© 2026. The Author(s). Published by the American Astronomical Society.
Copyright ©
2026 Astronomy Image Explorer. All Rights Reserved.