Image Details
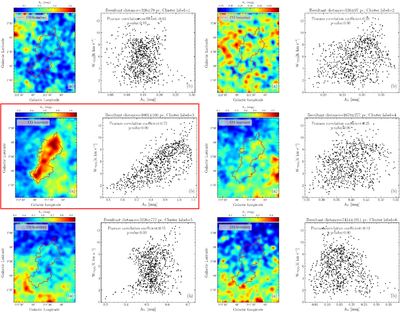
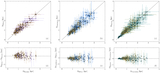
Caption: Figure 5.
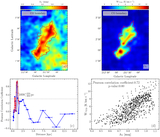
Reconstructed extinction maps from K-means clustering results and their Pearson correlation with 12CO integrated-intensity maps. Columns (1) and (3) display the reconstructed dust extinction maps. Columns (2) and (4) show the corresponding maps of the Pearson correlation between AV and WCO at the resultant distance for each cluster derived from the K-means clustering. The result marked with a red frame exhibits morphology most similar to that of the 12CO integrated-intensity map.
Other Images in This Article
Show More
Copyright and Terms & Conditions
© 2026. The Author(s). Published by the American Astronomical Society.
Copyright ©
2026 Astronomy Image Explorer. All Rights Reserved.