Image Details
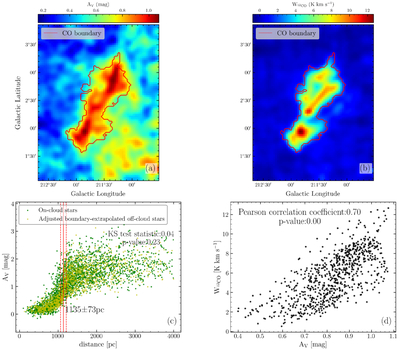
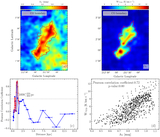
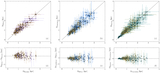
Caption: Figure 3.
Distance of MWISP G211.613+02.405+007.49 based on statistical analysis of extinction–distance distributions. (a) Extinction map corresponding to ±20% of the measured cloud distance. (b) The 12CO integrated-intensity map of the cloud. The maps in (a) and (b) are presented at a 2′ resolution, with the red contour tracing the cloud boundary identified from the 12CO emission. (c) The extinction–distance distributions for on-cloud (green points) and boundary-adjacent off-cloud (yellow points) stars. The red solid line indicates the estimated distance and the red dashed lines depict the uncertainty of the cloud distance. (d) Pearson correlation between the dust extinction (AV) and the 12CO integrated intensity (WCO) at the determined distance.
Other Images in This Article
Show More
Copyright and Terms & Conditions
© 2026. The Author(s). Published by the American Astronomical Society.