Image Details
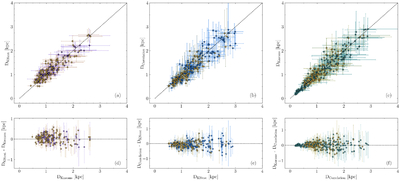
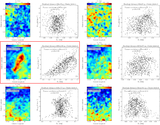
Caption: Figure 9.
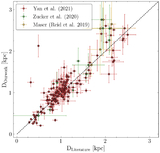
Comparison of molecular cloud distances derived using three independent methods in this work: the statistical method based on extinction–distance distribution differences (DKStest), the morphological-matching method (DKmeans), and correlation analysis of distance-sliced dust maps (DCorrelation). The top and bottom rows show pairwise comparisons and their corresponding difference plots, respectively: (a), (d) DKStest versus DKmeans; (b), (e) DCorrelation versus DKStest; and (c), (f) DCorrelation versus DKmeans. In all panels, molecular clouds with distances available from three methods are highlighted in yellow. The dashed lines indicate the one-to-one relation (top row) and the zero-difference line (bottom row).
Other Images in This Article
Show More
Copyright and Terms & Conditions
© 2026. The Author(s). Published by the American Astronomical Society.