Image Details
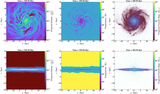
Caption: Figure 3.
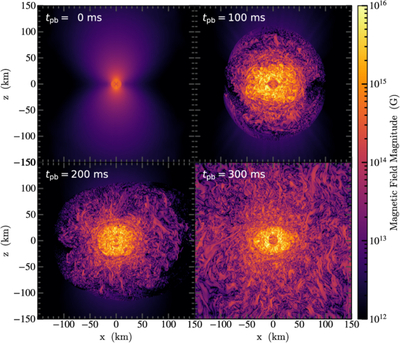
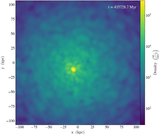
Distribution of magnetic field magnitude at various postbounce times tpb in a core-collapse supernova (CCSN) simulation performed with GAMER. The visualization data are extracted using the save_as_data set function in yt, then plotted and combined into a 12 s animation. The animation illustrates the evolution of the magnetic field within the central proto–neutron star and the turbulent postbounce shock region at high temporal resolution. Shock revival occurs at tpb ∼ 230 ms. The animation begins at tpb = −1.16 ms and ends at tpb = 305.19 ms with a real-time duration of 12 s.
(An animation of this figure is available in the online article.)
(An animation of this figure is available.)
The video/animation of this figure is available in the online journal.
Other Images in This Article
Show More
Copyright and Terms & Conditions
© 2026. The Author(s). Published by the American Astronomical Society.