Image Details
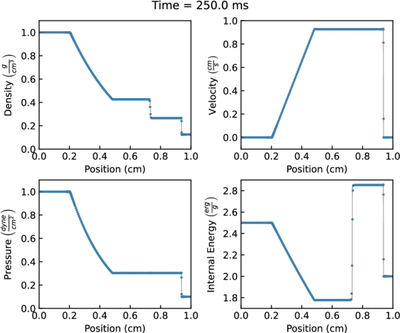
Caption: Figure 7.
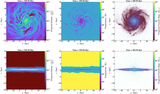
The classical Sod shock tube test results in density, velocity, pressure, and internal energy in Enzo simulation at t = 250 ms. The blue dots are results from the hydrodynamics solver in Enzo. The gray line represents the exact solution at t = 250 ms, which is plotted in the static figure for comparison purposes only. We use yt LinePlot to sample the data points in the simulation, and then use matplotlib to plot the figure. An animation is available that spans the full simulation and samples the evolution every 5 ms in simulation time. All of the results in chronological time steps are combined into a 3 s animation.
(An animation of this figure is available in the online article.)
(An animation of this figure is available.)
The video/animation of this figure is available in the online journal.
Other Images in This Article


Show More
Copyright and Terms & Conditions
© 2026. The Author(s). Published by the American Astronomical Society.