Image Details
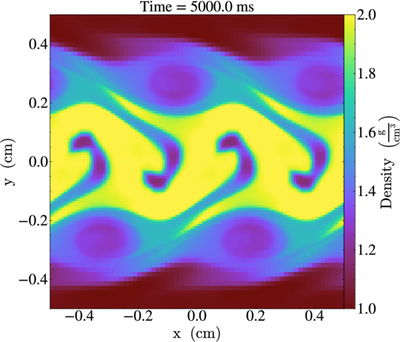
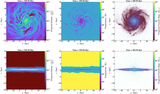
Caption: Figure 8.
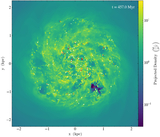
Density field from the Kelvin–Helmholtz instability test problem at t = 5000 ms, obtained with Enzo. We use yt SlicePlot to plot the data. The available animation spans the full simulation and samples the evolution every 5 ms in simulation’s physical time. All of the plotted figures are combined into a 50 s animation. It closely tracks the simulation from the initial condition to the turbulent state.
(An animation of this figure is available in the online article.)
(An animation of this figure is available.)
The video/animation of this figure is available in the online journal.
Other Images in This Article
Show More
Copyright and Terms & Conditions
© 2026. The Author(s). Published by the American Astronomical Society.
Copyright ©
2026 Astronomy Image Explorer. All Rights Reserved.