Image Details

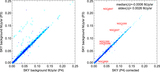
Caption: Figure 9.
Different contributions to the sky background noise. The symbols indicate the measured average noise in sky measurement regions (RMS) in the cryogenic mission archival images (left frame; for clarity only those with 30 s original frame time are shown) and in warm mission images (right panel), as a function of ecliptic latitude. The lines indicate various noise contributions and the total noise calculated with Equations (11) and (12) for clarity a mean over 20° bins is shown. Note that in the left panel the peaking of readout noise contribution close to ecliptic plane is just a spurious effect.
Other Images in This Article

Show More
Copyright and Terms & Conditions
© 2015. The American Astronomical Society. All rights reserved.
Copyright ©
2025 Astronomy Image Explorer. All Rights Reserved.