Image Details
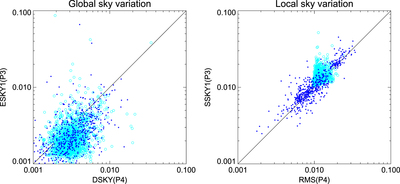
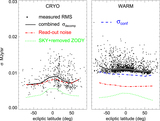
Caption: Figure 7.
Comparison of P4 and P3 sky variation estimates. Left panel displays the global variations, estimated from the standard deviation of sky measurements at different areas (variable “DSKY” in P4 and “SKY1” in P3; the symbol colors are the same as in the previous figure). Right panel the local variation, estimated from the median scatter of sky values in local measurement areas (variable “RMS” in P4 and “SSKY1” in P3).
Other Images in This Article

Show More
Copyright and Terms & Conditions
© 2015. The American Astronomical Society. All rights reserved.
Copyright ©
2025 Astronomy Image Explorer. All Rights Reserved.