Image Details
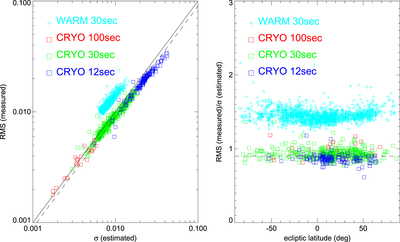
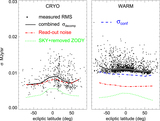
Caption: Figure 8.
Comparison of measured and theoretical σ. Left panle: the measured average rms in sky regions against the estimated σ, which takes into account the read-out noise, and the Poisson noise due to sky background (including the zodiacal light contribution removed by the automatic Spitzer pipeline). For the cryogenic mission phase the agreement is fairly good, with ﹩\mathrm{rms}\approx 0.9{\sigma }_{\mathrm{est}}﹩ (indicated by the dashed line; solid line indicates a one-to-one correspondence). For the warm phase the observed rms is about 50% larger than the theoretically estimated noise. Right panel: the ratio of the observed and estimated noise as a function of ecliptic latitude.
Other Images in This Article

Show More
Copyright and Terms & Conditions
© 2015. The American Astronomical Society. All rights reserved.