Image Details
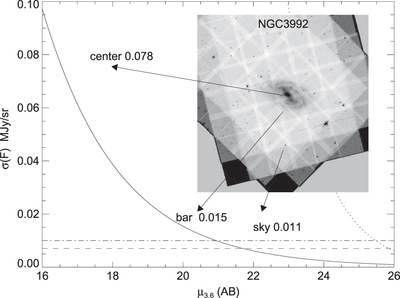
Caption: Figure 10.
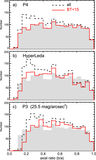
Comparison of galaxy flux and background noise contributions. The solid curve is the calculated Poisson noise associated with the galaxy flux Fgal, as a function of surface brightness (in 3.6 μm AB magnitudes; Fgal is converted to surface brightness with Equation (13)). The horizontal lines indicate the typical background noise levels for the warm and cryogenic mission phases (dotted–dashed and dotted lines, respectively; they include both the noise associated with sky background flux and instrumental contributions). The insert shows the sigma-map for NGC 3992. The structure in the background is due to different number of frames covering each pixel. Also notice how the galaxy stands out clearly on the sigma-map. The dotted line crossing the horizontal lines at ﹩{\mu }_{3.6}\approx 25.5﹩ indicates the galaxy flux in MJy sr−1.
Other Images in This Article

Show More
Copyright and Terms & Conditions
© 2015. The American Astronomical Society. All rights reserved.