Image Details
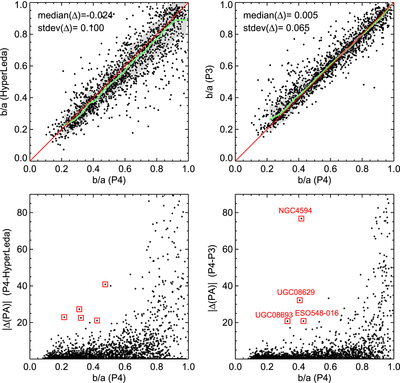
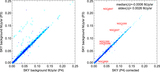
Caption: Figure 4.
Comparison of outer disk orientation parameters to those in HyperLeda, and to the P3 orientation parameters corresponding to fixed ﹩{\mu }_{3.6}=25.5﹩ mag arcsec−2 isophote. In the upper row axial ratios are compared: the green line indicates the running median of HyperLeda (or P3) axial ratio, calculated in bins of 100 galaxies; gray indicates the rms scatter in the bin. Red line indicates unit slope. The labels give the median difference and standard deviation of the difference compared to P4: P4 axial ratios are generally larger than those in HyperLeda while the difference to P3 is small. The lower frames displays the absolute difference in the position angles: squares mark deviant points with ﹩| {\rm{\Delta }}\mathrm{PA}| \gt 15^\circ ﹩ for ﹩b/a\lt 0.5﹩. In the upper panels only galaxies with orientation uncertainty flag “ok” are included, while in the lower panels also galaxies with flag “z” are included.
Other Images in This Article

Show More
Copyright and Terms & Conditions
© 2015. The American Astronomical Society. All rights reserved.