Image Details
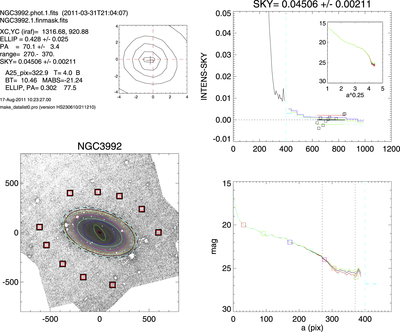
Caption: Figure 1.
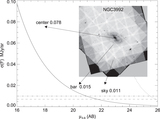
Example of the determination of sky background for NGC 3992. The small upper left panel illustrates the center location found with cntrd-routine (black cross) relative to the image isophotes near the center (dashed red lines indicate the nearest integer pixels). In the lower left panel, red boxes indicate the local regions used for estimating the sky background: the mean and the rms of these local median values were adopted for the sky background and its uncertainty (SKY and DSKY, respectively). The dashed ellipse indicates the visually estimated galaxy size (Rgal). The white specks indicate masked stars. The upper right panel shows the intensity profile after subtracting the SKY value (indicated in the title of the plot; note the linear scale, intensities are from IRAF ellipse fits), marking also the ±DSKY (vertical red/green lines) and the median sky values in local measurement regions (boxes). The vertical dashed line corresponds to Rgal. The insert shows the same profile, but as magnitude vs. ﹩{a}^{0.25}﹩, where a is the isophotal major-axis distance: a de Vaucouleurs profile would appear a straight line in this plot. The lower right panel shows the intensity profile in magnitude units (AB-magnitudes): red/green profiles correspond to adding/subtracting DSKY to the sky background. All distances are in pixels (0.″75). Similar plots for all sample galaxies are given on the P4 web site.
Other Images in This Article

Show More
Copyright and Terms & Conditions
© 2015. The American Astronomical Society. All rights reserved.