Image Details

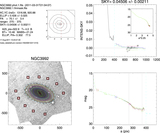
Caption: Figure 2.
Example of the isophotal profiles derived for NGC 3992 using the IRAF ellipse routine. The plots in the left display the PA and ellipticity profiles vs. semimajor axis (a) of isophote ellipse: the dashed vertical lines indicate the range used in estimating the outer disk orientation parameters; solid horizontal line indicates the mean over that range. The upper right panel shows the observed, sky subtracted image, clipped at ﹩1.3\times {R}_{\mathrm{gal}}﹩ (the image region used in decompositions). In the lower right, the isophotes are plotted on top of observed (masked) image: the blue isophotes correspond to the a range from which the outer disk orientation (﹩{\epsilon }_{\mathrm{outer}},{\mathrm{PA}}_{\mathrm{outer}}﹩) was derived; the blue line indicates the assigned PAouter. Similar plots for all sample galaxies are available on the P4 web site.
Other Images in This Article

Show More
Copyright and Terms & Conditions
© 2015. The American Astronomical Society. All rights reserved.