Image Details
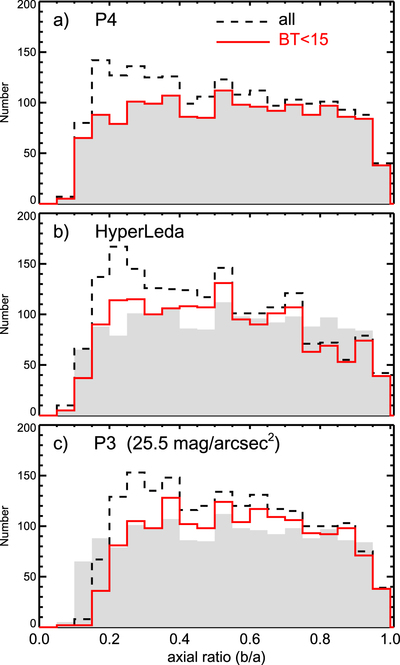
Caption: Figure 5.
Distribution of axial ratios, calculated with P4 (a), HyperLeda (b), and P3 orientation parameters. Hubble types ﹩T\leqslant -4﹩ and ﹩T\gt 10﹩ are excluded (using Buta et al. 2014 mid-IR classification). Dashed line indicates the whole S4G sample, with the magnitude selection ﹩{\mathrm{BT}}_{\mathrm{corr}}\lt 15.5﹩, where BTcorr is the inclination-corrected blue magnitude from HyperLeda. Solid line corresponds to a similar limit, but using non-corrected blue magnitude BT. To ease the comparison the P4 histogram for ﹩\mathrm{BT}\lt 15﹩ is shown as the shaded region in each frame.
Other Images in This Article

Show More
Copyright and Terms & Conditions
© 2015. The American Astronomical Society. All rights reserved.
Copyright ©
2025 Astronomy Image Explorer. All Rights Reserved.