Image Details
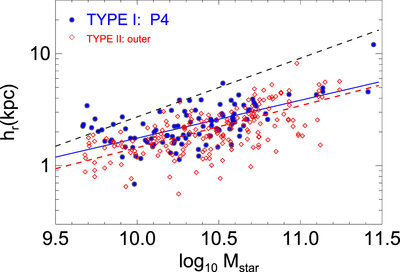
Caption: Figure 30.
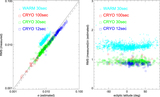
Comparison of P4 scalelengths for Type I galaxies (blue points), with the outer scalelengths of Type II profiles (red points; these combining Muñoz-Mateos et al. 2013; Laine et al. 2014 and Kim et al. 2014 measurements). Also shown are the corresponding orthonormal fits (solid blue and dashed red lines, respectively). The black dashed line shows a fit to inner scalelengths derived in the above mentioned studies (individual measurement points not shown). Note that the trend of single scalelengths in Type I galaxies resemble much more the outer scalelengths in Type II’s rather than the inner scalelengths.
Other Images in This Article

Show More
Copyright and Terms & Conditions
© 2015. The American Astronomical Society. All rights reserved.