

Image Details
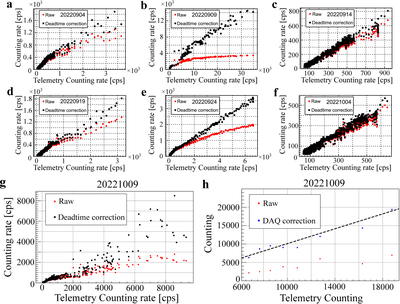
Caption: Figure F4.
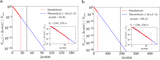
Correction for instrumental effects across varying flux levels. (a)–(f) Verification of the baseline correction under low-flux conditions using six revisiting orbits preceding the burst. Compared to the raw data (red data points), the dead-time-corrected energy spectrum count rate (black data points) shows a linear relationship with the total telemetry count rate, where y = x. (g) Saturation analysis during the main burst phase of GRB 221009A. The conventional dead-time correction (black points) deviates from linearity as telemetry rates exceed ∼4000 counts per second (cps). (h) High-flux signal recovery via the comprehensive DAQ correction (blue points). The black dashed line represents the ideal linear identity (y = x).
Other Images in This Article
Show More
Copyright and Terms & Conditions
© 2026. The Author(s). Published by the American Astronomical Society.

