

Image Details
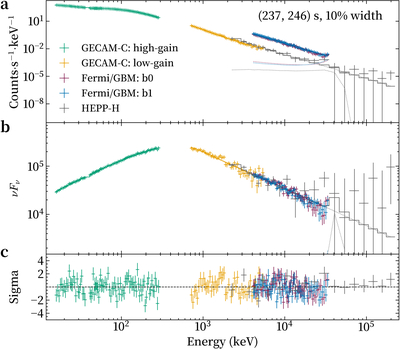
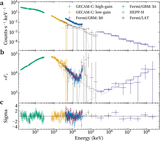
Caption: Figure F7.
Spectral identification of an emission line feature (Tref + 237–246 s). The analysis incorporates unsaturated observations from HEPP-H, GECAM-C, and Fermi/GBM. (a) The count spectrum. (b) The νFν spectral distribution (units of keV2 · photons · cm−2 · s−1 · keV−1). (c) Residuals in units of standard deviation (σ) with 1σ error bars. Solid lines indicate the best-fitting model (Band function + Gaussian line), while dashed lines denote individual components. Time intervals indicated in parentheses are relative to Tref.
Other Images in This Article
Show More
Copyright and Terms & Conditions
© 2026. The Author(s). Published by the American Astronomical Society.

Copyright ©
2026 Astronomy Image Explorer. All Rights Reserved.
