

Image Details
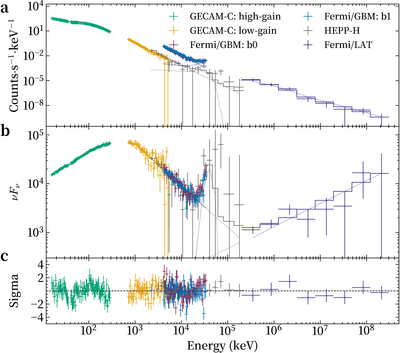
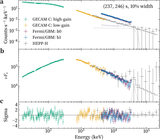
Caption: Figure F8.
Joint spectral fitting results within the time interval Tref + 246–256 s. The energy spectrum is reconstructed using a multicomponent model consisting of Band, Gaussian, and PL functions. (a) Observed count rate spectrum compared with the folded best-fit model. Data are presented for GECAM-C (high-gain in green; low-gain in orange), Fermi/GBM BGO detectors (b0 in purple; b1 in blue), HEPP-H (gray), and Fermi/LAT (dark blue). (b) The νFν spectral distribution (units of keV2 · photons · cm−2 · s−1 · keV−1). The total model (solid curve) is the superposition of individual components (dashed curves), which include the low-energy Band, the high-energy PL, and a Gaussian spectral line feature centered near 37 MeV. (c) Residuals in units of standard deviation (σ) with 1σ error bars.
Other Images in This Article
Show More
Copyright and Terms & Conditions
© 2026. The Author(s). Published by the American Astronomical Society.

