

Image Details
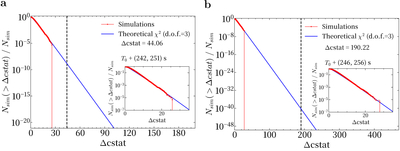
Caption: Figure F6.
Statistical significance verification via MC simulations. Red points represent the distribution of ΔC-statistic values derived from synthetic datasets, while blue line correspond to the theoretical χ2 distribution with three dof. The vertical black dashed line indicates the observed ΔC-statistic improvement obtained by adding the Gaussian component to the fit. Empirical p-values are calculated directly where the observed statistic falls within the simulated range. For observed values exceeding the simulated distribution, where direct computation is computationally prohibitive, an upper limit of p < 1/N is adopted, where N represents the number of simulations, alongside the theoretical significance. (a) Results for the interval Tref + (242, 251) s. (b) Results for the interval Tref + (246, 256) s.
Other Images in This Article
Show More
Copyright and Terms & Conditions
© 2026. The Author(s). Published by the American Astronomical Society.

