

Image Details
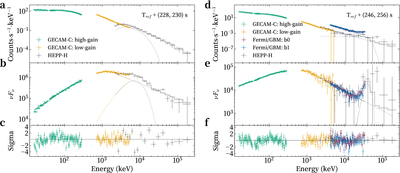
Caption: Figure 2.
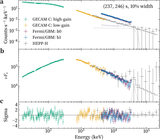
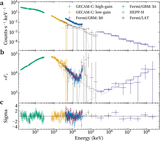
Joint spectral characterization of GRB 221009A across multiple time periods. (a)–(c) Analysis for the high-flux peak phase (Tref + 228–230 s) utilizing a Band + BB model. (d)–(f) Spectral analysis for the late decay phase (Tref + 246–256 s) utilizing a multicomponent Band + Gaussian model. Panels (a) and (d) show observed count rate spectra compared with the folded best-fit models (solid lines). Data are from GECAM-C (high-gain in green; low-gain in orange), Fermi/GBM bismuth germanate (BGO) detectors (b0 in purple; b1 in blue) and HEPP-H (gray). Panels (b) and (e) show the νFν spectral distribution (units of keV2 · photons · cm−2 · s−1 · keV−1). For the peak phase (b), the displayed spectrum is fitted with the Band + BB model. For the late phase (e), the model includes a Band tail and a Gaussian line feature centered near 37 MeV. In both time periods, HEPP-H data (gray) span the 2–255 MeV energy range. Panels (c) and (f) show residuals in units of standard deviation (σ) with 1σ error bars.
Other Images in This Article
Show More
Copyright and Terms & Conditions
© 2026. The Author(s). Published by the American Astronomical Society.

