

Image Details
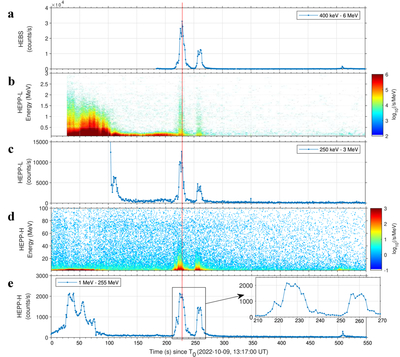
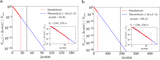
Caption: Figure 1.
Temporal evolution of GRB 221009A observed by GECAM-C (HEBS) and CSES-01. (a) The light curve from GECAM-C in the 400 keV–6 MeV range, showing the primary gamma-ray emission. The GECAM-C data are shown starting from approximately Tref + 180 s because the preceding interval was contaminated by high background due to the high-latitude effect (Z.-H. An et al. 2023). Panels (a) and (c) show the energy-time spectrogram and integrated light curve (250 keV–3 MeV) of the secondary particles detected by HEPP-L, respectively. Panels (d) and (e) show the corresponding spectrogram and integrated light curve (1–255 MeV) from HEPP-H, respectively. The vertical red line marks the time of the main emission peak.
Other Images in This Article
Show More
Copyright and Terms & Conditions
© 2026. The Author(s). Published by the American Astronomical Society.

