

Image Details
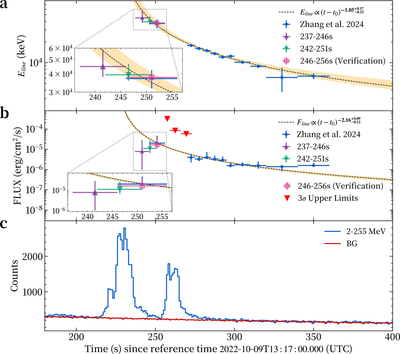
Caption: Figure 3.
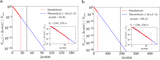
Evolution of emission line parameters in GRB 221009A. (a) Temporal evolution of the central line energy (Eline). The black dashed line depicts the PL decay model (﹩{E}_{{\rm{line}}}\propto {(t-{t}_{0})}^{-1.05}﹩) constrained by data from later intervals. The purple, cyan, and pink crosses mark the measurement results for the Tref + 237–246, 242–251, and 246–256 s intervals, respectively. Note that the blue crosses represent observations from previous study (Y.-Q. Zhang et al. 2024). (b) Evolution of the emission line flux. The black dashed line indicates the PL decay trend (﹩{F}_{{\rm{line}}}\propto {(t-{t}_{0})}^{-2.16}﹩). No significant emission line signals were detected in the 256–273 s interval, providing only 3σ flux upper limits (red triangles), where 3σ represents the statistical uncertainty of the flux measurement (equivalent to a 99.7% confidence level). (c) The HEPP-H count rate light curve (2–255 MeV).
Other Images in This Article
Show More
Copyright and Terms & Conditions
© 2026. The Author(s). Published by the American Astronomical Society.

