Image Details

Choose export citation format:

Detection of 2 MeV Spectral Bump and ∼40 MeV Emission Line from GRB 221009A

  • Authors: Zhi-Qiang Ding, Zhenxia Zhang, Yanqiu Zhang, Rui-Ze Shi, Xinqiao Li, Zhuo Li, Zhenghua An, Shaolin Xiong, Roberto Battiston, Shuangnan Zhang, Hua Feng, Dali Zhang, Yanbing Xu, Ping Wang, Xiaoyun Zhao, Yuqian Ma, Hong Lu, Xiangyang Wen, Yongjie Zhang, Xuhui Shen, Shigeng Yuan, Siquan Yang, Rongxue Kang, Chao Zheng, Yan Huang, Wen Su, Shengli Liu, Hui Wang, Xiaohua Liang, Jinzhou Wang, Ke Gong, Xiaojing Liu, Yaqing Liu, Sheng Yang, Zeren Zhima, Jianping Huang, Wei Chu, Na Zhou, Roberto Iuppa, Francesco Maria Follega, Marco Cristoforetti, Wangchen Xue, Lu Wang, Jiaqi Zheng, Jiacong Liu, Chenwei Wang, Wenjun Tan, Zhenghang Yu, Shujie Li, Hao Hong

Zhi-Qiang Ding et al 2026 The Astrophysical Journal Letters 1012 .

  • Provider: AAS Journals

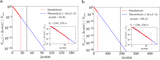
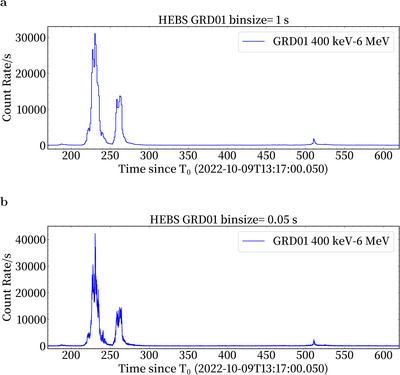
Caption: Figure F2.

Multiresolution light curves of GRB 221009A observed by GECAM-C (HEBS). The figure shows the light curve in the 400 keV–6 MeV range from a single GRD (GRD01) unit. (a) The light curve binned at 1 s resolution, showing the overall morphology of the main emission episode, which consists of two prominent peaks. (Z.-H. An et al. 2023; Y.-Q. Zhang et al. 2024). (b) The same data binned at a high resolution of 0.05 s, revealing the rapid and complex variability within these peaks.

Other Images in This Article
Show More

Copyright and Terms & Conditions

Additional terms of reuse