

Image Details
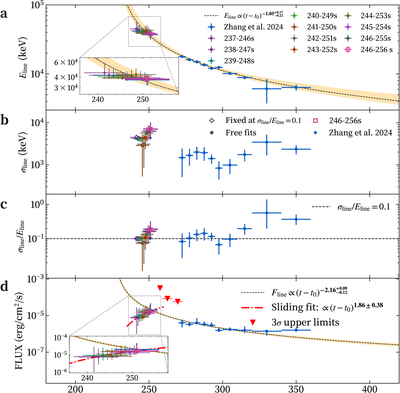
Caption: Figure F16.
Comprehensive sliding-window analysis of the spectral line evolution. (a) Temporal evolution of the central line energy (Eline), determined using a 9 s moving window with a 1 s step. Each colored point corresponds to a specific time interval, as defined in the legend. The black dashed line and orange shaded region represent the PL decay model, ﹩{E}_{{\rm{line}}}\propto {(t-{t}_{0})}^{-1.05}﹩, and its associated uncertainty, respectively. (b) Temporal evolution of the Gaussian line width (σline). The open diamonds denote intervals for which the relative line width was fixed at σline/Eline = 0.1, whereas the filled points represent free fits. The measurements from Y.-Q. Zhang et al. (2024) are shown in blue. (c) Evolution of the relative line width, σline/Eline. The horizontal dashed line marks σline/Eline = 0.1. (d) Temporal evolution of the emission line flux using the same sliding-window color scheme. The red dashed–dotted line denotes the fit to the sliding-window measurements, ﹩{F}_{{\rm{line}}}\propto {(t-{t}_{0})}^{1.86\pm 0.38}﹩, while the black dashed line and orange shaded region indicate the late-time decay model, ﹩{F}_{{\rm{line}}}\propto {(t-{t}_{0})}^{-2.16}﹩, and its associated uncertainty. Note: for the intervals from Tref + 237–246 through Tref + 240–249 s, the relative line width was fixed at σline/Eline = 0.1 because of the limited statistics. Beginning with the Tref + 241–250 s interval, all line parameters were allowed to vary freely.
Other Images in This Article
Show More
Copyright and Terms & Conditions
© 2026. The Author(s). Published by the American Astronomical Society.

