

Image Details
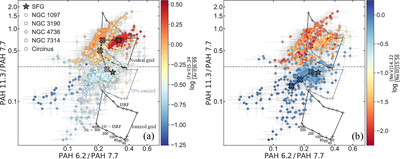
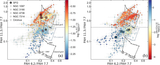
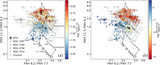
Caption: Figure 5.
Same as Figure 4, but color-coded by the different strength indicators of (a) shock processing ([Fe II] 5.34/[Ar II] 6.99) and (b) AGN irradiation ([Ne V] 14.32/[Ne III] 15.56). The reddish and bluish crosses in panels (a) and (b) show, for the five AGN targets, the median PAH band ratios of the spaxels in bins of increasing log ([Fe II] 5.34/[Ar II] 6.99) of [−0.5, −0.25], [−0.25, 0], [0, 0.25], and [0.25, 0.5] and increasing log ([Ne V] 14.32/[Ne III] 15.56) of [−0.5, −0.3], [−0.3, −0.15], [−0.15, 0], and [0, 0.2] (from light to dark), respectively.
Other Images in This Article
Copyright and Terms & Conditions
© 2026. The Author(s). Published by the American Astronomical Society.

Copyright ©
2026 Astronomy Image Explorer. All Rights Reserved.
