

Image Details
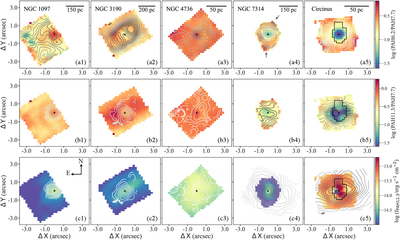
Caption: Figure 3.
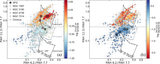
Spatially resolved maps of PAH 6.2/7.7 ratio (top panels), PAH 11.3/7.7 ratio (middle panels), and PAH 11.3 μm emission (bottom panels) for the five AGN targets. Each column corresponds to one target, with the AGN position denoted by a black star. A common color scale is adopted for all panels within a given row and is shown on the right. The contours in the top, middle, and bottom panels show the distributions of log (rH2) (−2.25 to −0.5), log (rNe) (−4.0 to 0.15), and log (f[Ne V] 14.32 μm/erg s−1 cm−2) (−18.0 to −13.3), respectively, with higher values indicated by darker colors on a common scale for each row. The black arrows in panel (a4) indicate the locations of the two radio spots in NGC 7314. The black polygons in Circinus outline the region within which the spaxels are shown here for illustrative purposes; these spaxels are excluded from the statistical analyses owing to the lack of reliable spaxel-based measurements of [Ne III] 15.56 μm and/or H2 S(1) and S(2), as detailed in Section 2.2. North is up in all panels, and the physical scale of each target is labeled in the upper right corner of each top panel.
Other Images in This Article
Copyright and Terms & Conditions
© 2026. The Author(s). Published by the American Astronomical Society.

