

Image Details
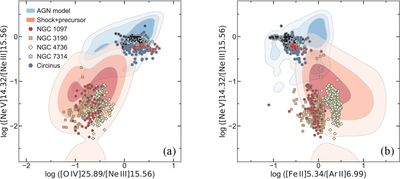
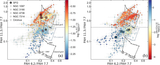
Caption: Figure A2.
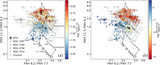
Diagnostic diagrams of ionized emission-line ratios: (a) [Ne V] 14.32/[Ne III] 15.56 vs. [O IV] 25.89/[Ne III] 15.56 and (b) [Ne V] 14.32/[Ne III] 15.56 vs. [Fe II] 5.34/[Ar II] 6.99 for ﹩0\mathop{.}\limits^{^{\prime\prime} }2\times 0\mathop{.}\limits^{^{\prime\prime} }2﹩ spaxels in the central ∼4″ × 4″ regions of the five AGN targets. The data points with a black circle pertain to spaxels in NGC 7314 and Circinus with PAH 11.3/7.7 < 0.2 and PAH 6.2/7.7 < 0.15, while the points with a red plus sign pertain to those with PAH 11.3/7.7 > 0.4. The bluish and reddish contours show the distributions of model results computed by L. Zhang et al. (2025) for AGN and fast radiative shocks (including the shock precursor), respectively. The included AGN models span ionization parameter log U from −2.3 to −1.8, AGN spectrum peak energy log (Epeak/keV) from −2.1 to −0.9, metallicities of 1.5–2 Z⊙, and gas pressure log (P/k) from 7.0 to 9.5. The included shock models cover shock velocities vs from 100 to 400 km s−1, pre-shock density nH from 103 to 104 cm−3, ratio of magnetic to ram pressure ηM from 0.0 to 0.001, and metallicities of 1.5–2 Z⊙. In each case, the contours enclose 30%, 60%, and 90% of the model results, from the innermost to the outermost levels. Note that some spaxels have valid [Ne V] 14.32 μm measurements from Ch3 but no corresponding [O IV] 25.89 μm measurements from Ch4; consequently, panel (a) contains fewer data points than panel (b).
Other Images in This Article
Copyright and Terms & Conditions
© 2026. The Author(s). Published by the American Astronomical Society.

