

Image Details
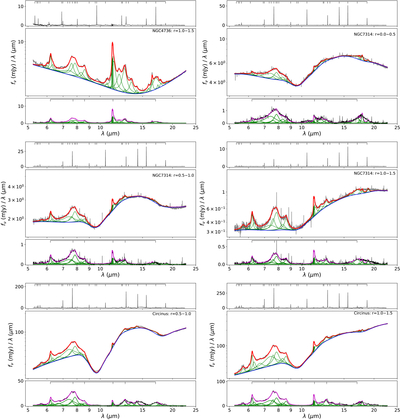
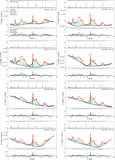
Caption: Figure A4.
Top panels: emission-line spectra obtained by subtracting the PAH emission and underlying continuum (i.e., the red curves in the middle panels) from the integrated MIRI/MRS spectra extracted from the ﹩r\,\leqslant \,0\mathop{.}\limits^{^{\prime\prime} }5﹩, ﹩0\mathop{.}\limits^{^{\prime\prime} }5\,\leqslant \,r\,\leqslant \,1\mathop{.}\limits^{^{\prime\prime} }0﹩, and ﹩1\mathop{.}\limits^{^{\prime\prime} }0\,\leqslant \,r\,\leqslant \,1\mathop{.}\limits^{^{\prime\prime} }5﹩ regions of each target. From left to right, the short markers at the top indicate the positions of the [Fe II] 5.34 μm, [Fe VIII] 5.45 μm, [Mg VII] 5.50 μm, [Mg V] 5.61 μm, H2 S(6), H2 S(5), [Ar II] 6.985 μm, [Na III] 7.32 μm, Pfα, [Ne VI] 7.65 μm, [Fe VII] 7.815 μm, [Ar V] 7.90 μm, H2 S(4), [Ar III] 8.99 μm, [Fe VII] 9.53 μm, H2 S(3), [S IV] 10.51 μm, H2 S(2), Huα, [Ne II] 12.81 μm, [Ar V] 13.10 μm, [Ne V] 14.32 μm, [Ne III] 15.555 μm, H2 S(1), and [S III] 18.71 μm emission lines. Middle panels: illustrations of the multicomponent fitting procedure used for the PAH measurements (see Section 2.3). The gray curves show the observed MIRI/MRS spectra with emission lines masked. The red curves represent the best-fit models consisting of PAH emission and the underlying continuum. The blue curves show the combined underlying continuum components (i.e., stellar and dust continua), while the green curves represent the individual PAH features modeled with Drude profiles. Bottom panels: PAH spectra (black curves) obtained by subtracting all continuum components (i.e., the blue curves in the middle panels) from the emission-line-masked MIRI/MRS spectra. As in the middle panels, the green curves represent individual PAH features modeled with Drude profiles, while the magenta curves show their sum, corresponding to the modeled PAH spectra. From left to right, the short markers at the top indicate the positions of the PAH complexes centered near 6.2, 7.7, 8.6, 11.3, 12.7, and 17.0 μm. Note that all x-axes, as well as the y-axes in the middle panels, are shown on logarithmic scales, whereas the y-axes in the top and bottom panels are shown on linear scales. No spectrum is shown for the ﹩r\,\leqslant \,0\mathop{.}\limits^{^{\prime\prime} }5﹩ region of Circinus, as noted in Figure A3.
Other Images in This Article
Copyright and Terms & Conditions
© 2026. The Author(s). Published by the American Astronomical Society.

