

Image Details
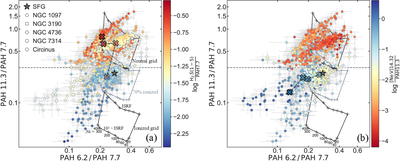
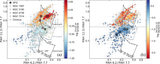
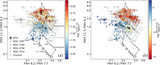
Caption: Figure 4.
PAH band ratio diagrams for ﹩0\mathop{.}\limits^{^{\prime\prime} }2\times 0\mathop{.}\limits^{^{\prime\prime} }2﹩ spaxels in the central ∼4″ × 4″ regions of the five AGN targets, color-coded by the strength indicators of (a) shock processing (rH2) and (b) AGN irradiation (rNe). The horizontal dashed lines mark the empirical demarcation at PAH 11.3/7.7 = 0.3. The reddish and bluish crosses in panels (a) and (b) show, for the five AGN targets, the median PAH band ratios of the spaxels in bins of increasing log (rH2) of [−2, −1.5], [−1.5, −1.0], [−1.0, −0.5], and [−0.5, 0], and increasing log (rNe) of [−2, −1.5], [−1.5, −0.75], [−0.75, 0], and [0, 0.5] (from light to dark), respectively. The gray star labeled “SFG” represents the median PAH band ratios of the spatially resolved spaxels in star-forming galaxies measured by L. Zhang et al. (2022); the individual star formation spaxels, which are clustered around the median value, are omitted for clarity. The grids marked by a plus sign in each panel show model predictions of PAH band ratios from D. Rigopoulou et al. (2024) for neutral (top grids), 70% ionized (middle grids), and fully ionized (bottom grids) PAHs of various sizes (carbon number NC = 20–400, increasing from the right to the left boundary of each grid). The grids span the interstellar radiation field (ISRF; top boundary) up to 103 × ISRF (bottom boundary).
Other Images in This Article
Copyright and Terms & Conditions
© 2026. The Author(s). Published by the American Astronomical Society.

