

Image Details
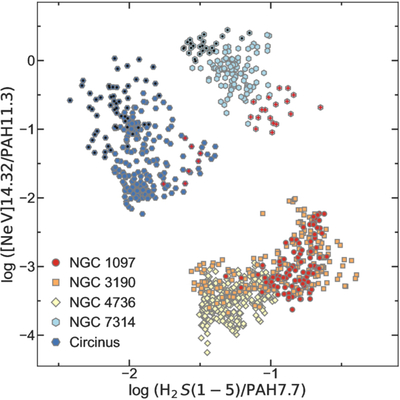
Caption: Figure A1.
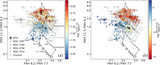
Diagnostic diagram of [Ne V] 14.32/PAH 11.3 (i.e., rNe) vs. H2 S(1–5)/PAH 7.7 (i.e., rH2) for ﹩0\mathop{.}\limits^{^{\prime\prime} }2\times 0\mathop{.}\limits^{^{\prime\prime} }2﹩ spaxels in the central ∼4″ × 4″ regions of the five AGN targets. The data points highlighted with black circles pertain to spaxels in NGC 7314 and Circinus with PAH 11.3/7.7 < 0.2 and PAH 6.2/7.7 < 0.15, while the points highlighted with red plus signs pertain to those with PAH 11.3/7.7 > 0.4.
Other Images in This Article
Copyright and Terms & Conditions
© 2026. The Author(s). Published by the American Astronomical Society.

Copyright ©
2026 Astronomy Image Explorer. All Rights Reserved.
