

Image Details
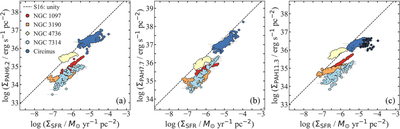
Caption: Figure 1.
Correlations between the surface brightness of the PAH (a) 6.2 μm (b) 7.7 μm, and (c) 11.3 μm emission and the SFR surface density for ﹩0\mathop{.}\limits^{^{\prime\prime} }2\times 0\mathop{.}\limits^{^{\prime\prime} }2﹩ spaxels in the central ∼4″ × 4″ regions of the five AGN targets, where ﹩{{\rm{\Sigma }}}_{{\rm{PAH}}}={L}_{{\rm{PAH}}}\,\cos (i)/A﹩ and ﹩{{\rm{\Sigma }}}_{{\rm{SFR}}}={\rm{SFR}}\,\cos (i)/A﹩. Here i is the galaxy inclination angle and A is the spaxel area in pc2. The dashed lines represent the unity PAH–SFR relations calibrated by H. V. Shipley et al. (2016; S16: unity) for star-forming galaxies. The data points highlighted with black circles represent spaxels in the central r ≈ 15–25 pc region of Circinus (the inner region is excluded from the analysis, as detailed in Section 2.2). Unless otherwise specified, the analysis presented here and in subsequent figures includes only spaxels with measurements of all five H2 transitions required for the shock-processing indicator and all three neon emission lines used for SFR estimation and the AGN irradiation indicator.
Other Images in This Article
Copyright and Terms & Conditions
© 2026. The Author(s). Published by the American Astronomical Society.

