

Image Details
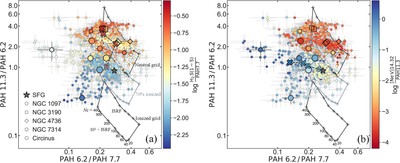
Caption: Figure A3.
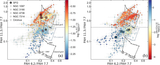
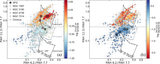
Same as Figure 4, but with the y-axis replaced by the PAH 11.3/6.2 ratio. In addition, the PAH band ratios derived from the integrated spectra extracted within the ﹩r\,\leqslant \,0\mathop{.}\limits^{^{\prime\prime} }5﹩, ﹩0\mathop{.}\limits^{^{\prime\prime} }5\,\leqslant \,r\,\leqslant \,1\mathop{.}\limits^{^{\prime\prime} }0﹩, and ﹩1\mathop{.}\limits^{^{\prime\prime} }0\,\leqslant \,r\,\leqslant \,1\mathop{.}\limits^{^{\prime\prime} }5﹩ regions of each target are plotted with the same symbols and color coding as the spaxels in the five AGN but are distinguished by black outlines of increasing size corresponding to the three radial apertures. Note that no data point is shown for the ﹩r\,\leqslant \,0\mathop{.}\limits^{^{\prime\prime} }5﹩ region of Circinus, as spaxels within this aperture are affected by saturation effects (see Figure 3 and its caption).
Other Images in This Article
Copyright and Terms & Conditions
© 2026. The Author(s). Published by the American Astronomical Society.

