

Image Details
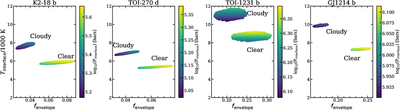
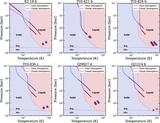
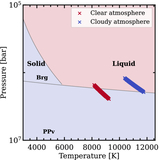
Caption: Figure 6.
Each panel shows the temperature of the atmosphere–mantle interface as a function of the envelope mass fraction (fenvelope) for the cloudy and clear models shown in Figure 5. The color of each point depicts the pressure of the atmosphere–mantle interface. The locus of interfaces in the T–fenvelope space for the cloudy and clear models are marked. The dependence of the interface temperature and pressure on fenvelope for the other four sub-Neptunes in our sample are shown in Appendix B.
Other Images in This Article
Show More
Copyright and Terms & Conditions
© 2026. The Author(s). Published by the American Astronomical Society.

Copyright ©
2026 Astronomy Image Explorer. All Rights Reserved.
