

Image Details
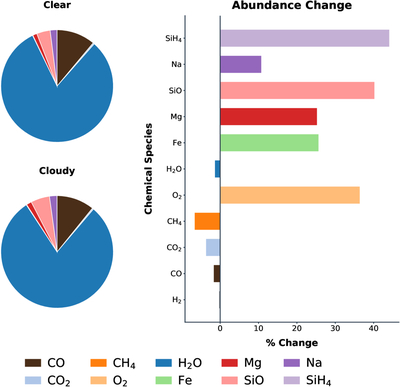
Caption: Figure 7.
The two pie charts show the fraction of individual molecules at the molten atmosphere–mantle interface for TOI-270 d for the clear (top pie chart) and cloudy (bottom pie chart) models, assuming 50× solar metallicity. The fraction shown in the pie charts has been calculated for all gases except H2, i.e., fraction of i’th gas is defined as ﹩{f}_{i}=\frac{{X}_{i}}{1-{X{}_{{\rm{H}}}}_{2}}﹩, where Xi is the abundance of the i’th gas at the atmosphere–mantle interface. The pie charts highlight fractions for the dominant non-H2 gases including CO, H2O, Na, SiO, and Mg, while gases like CO2, CH4, O2, or Fe are present but not visible. The side panel shows the percent change in the abundance of gases in the cloudy model relative to the clear model for each molecule following the same color scheme as the pie charts. A positive value indicates that the gas abundance has increased in the cloudy model relative to the clear model.
Other Images in This Article
Show More
Copyright and Terms & Conditions
© 2026. The Author(s). Published by the American Astronomical Society.

