

Image Details
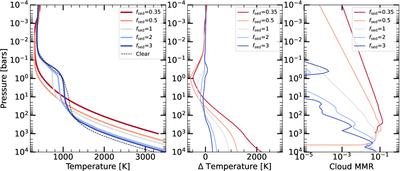
Caption: Figure 2.
Left panel: T(P) profiles of TOI-270 d for various cloud sedimentation parameter fsed values between 3 and 0.35 are shown with the solid colored lines. The T(P) profile for the clear atmospheric model is shown with the dashed black line. Middle panel: difference in temperature between the cloudy atmospheric model and the clear atmospheric model for each fsed value is shown as colored lines. A positive value suggests that the cloudy model is hotter than the clear model at that pressure. Right panel: the variation of the total cloud mass mixing ratio with fsed is shown. The mass mixing ratios of all individual gases are summed together to get the total cloud mass mixing ratio.
Other Images in This Article
Show More
Copyright and Terms & Conditions
© 2026. The Author(s). Published by the American Astronomical Society.

