

Image Details
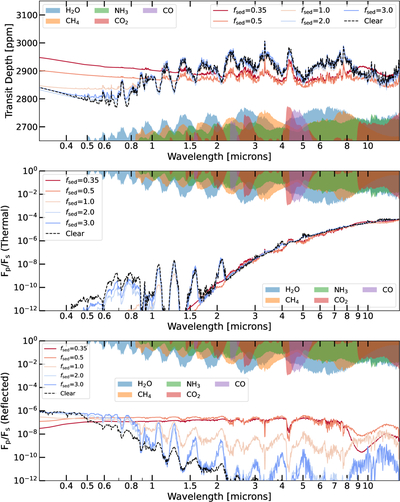
Caption: Figure 8.
Top panel: the transmission spectra for the clear and cloudy models for TOI-270 d shown in Figure 2. These models assume a metallicity of 200 × solar. Each colored line shows the spectra for a different fsed value, whereas the spectra for the clear atmosphere are shown with the black dashed line. The y-axis shows the transit depth in parts per million. The opacities of major atmospheric absorbers scaled by their abundance in the clear model are shown as filled regions at the bottom for identification of absorption features in the transmissions spectrum. Middle panel: the same as the top panel but for the thermal component of the eclipse spectrum for TOI-270 d. The y-axis shows the ratio of the planet and stellar flux. Bottom panel: the same as the middle panel but for the reflected-light component. The middle and bottom panels also show the abundance-scaled opacities at the top in an inverted scale for identification of features.
Other Images in This Article
Show More
Copyright and Terms & Conditions
© 2026. The Author(s). Published by the American Astronomical Society.

