

Image Details
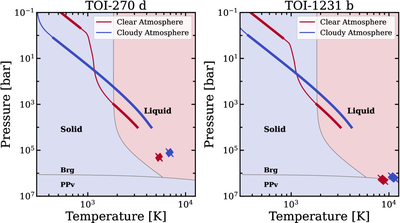
Caption: Figure 5.
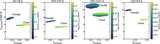
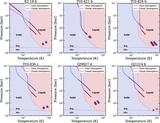
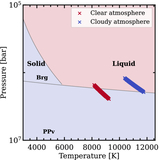
Two panels show the T(P) profiles for the clear atmosphere (red line) and cloudy atmosphere (blue line) computed for TOI-270 d and TOI-1231 b. The thicker lines depict the convective regions of the atmosphere. The locus of blue and red crosses shows the P and T locations of the atmosphere–mantle interface computed by coupling our atmospheric model with the interior structure model for the cloudy and clear models, respectively. The P–T location and the T(P) profiles are overlaid on the phase diagram for silicates, depicting its solid and molten phases as blue and red shaded regions, respectively. The bridgmanite–postperovskite (Brg–PPv) boundaries are also shown. The atmosphere–mantle interface is a locus of points instead of a single point in the P–T space because of its sensitivity to the envelope mass fraction fenvelope. All cloudy models have been computed assuming fsed = 0.5. The interface conditions for the values of fenvelope that are consistent with the measured planet mass and radius are shown. The interfaces of the other six planets in our sample along with a zoomed-in view of the interface conditions for TOI-1231 b are shown in Appendix A.
Other Images in This Article
Show More
Copyright and Terms & Conditions
© 2026. The Author(s). Published by the American Astronomical Society.

