

Image Details
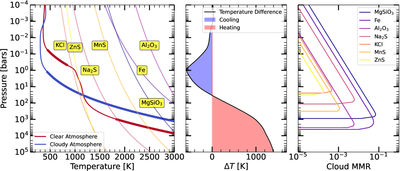
Caption: Figure 1.
Left panel: the T(P) profiles for a clear (red line) and cloudy (blue line) model for TOI-270 d’s atmosphere are shown along with condensation curves for several mineral cloud species. The thicker regions depict convective regions of the atmosphere, and the models have been computed for [M/H] = +2.3 and fsed = 0.5. Middle panel: the temperature difference between the cloudy and clear atmospheres as a function of pressure. Right panel: mass mixing ratio profiles as a function of pressure for the mineral cloud species considered in our models.
Other Images in This Article
Show More
Copyright and Terms & Conditions
© 2026. The Author(s). Published by the American Astronomical Society.

Copyright ©
2026 Astronomy Image Explorer. All Rights Reserved.
