

Image Details
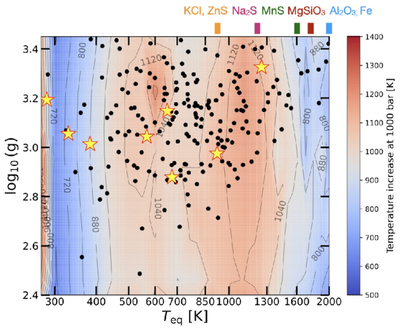
Caption: Figure 4.
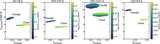
The difference in temperature at 1000 bar pressure between cloudy and clear models is shown as a function of planet Teq and log(g). The cloudy and clear grid of models has been computed assuming 100× solar metallicity, solar C/O ratio, and Tint = 50 K after adopting the stellar properties of TOI-270 d. The cloudy models assume fsed = 0.5. The Teq at which each cloud species starts forming clouds for log(g) = 3.0 has been marked at the top of the panel with colored vertical lines. Black points show the sample of transiting sub-Neptune planets with 1.7 ≤ Rp ≤ 4 R⊕. Planets that have radius and mass measurements with ≤25% uncertainty are shown here. The yellow stars show our sample of eight sub-Neptunes, which span the range of Teq and ﹩\mathrm{log}(g)﹩ occupied by the broader sub-Neptune population and for which we have explored the impact of clouds on the atmosphere–mantle interface.
Other Images in This Article
Show More
Copyright and Terms & Conditions
© 2026. The Author(s). Published by the American Astronomical Society.

