Image Details
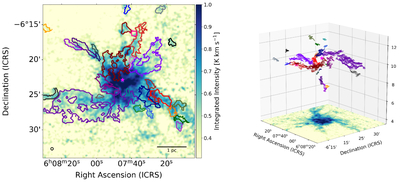
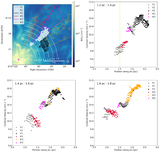
Caption: Figure 6.
Left: map of the integrated intensity of C18O integrated over velocities from 8 km s−1 to 13 km s−1. The velocity-coherent components of C18O emission are shown as the color contours. The magenta star indicates the position of the IRS 1 source that we consider in our analysis as the center of the hub of Mon R2. The effective beam size of 21.8″ of the Nobeyama C18O observations is shown as the black circle in the lower left corner. The physical scale bar of 1 pc at the distance of 830 pc is shown in the lower right corner. Right: the position–position–velocity map of velocity-coherent structures, with colors the same as those in the left panel. This is available online as an interactive figure.
Other Images in This Article
Copyright and Terms & Conditions
© 2026. The Author(s). Published by the American Astronomical Society.