Image Details
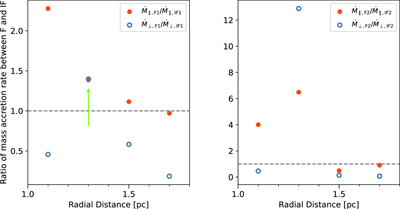
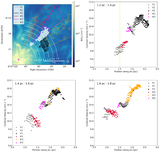
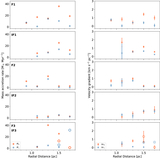
Caption: Figure 2.
Ratio of local mass accretion rate between Fs and IFs along (∥, red circles) and across (⊥, blue circles) the structure. The left and right panels show the ratios between F1 and IF1 and between F2 and IF2, respectively. The green arrow indicates the subregion containing the prestellar core shown in Figure 1. The dashed lines indicate a ratio of one.
Other Images in This Article
Copyright and Terms & Conditions
© 2026. The Author(s). Published by the American Astronomical Society.
Copyright ©
2026 Astronomy Image Explorer. All Rights Reserved.