Image Details
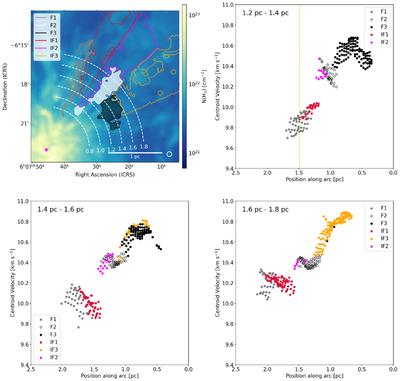
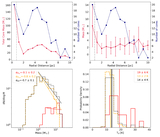
Caption: Figure 8.
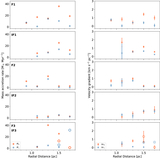
Top left: Fs and IFs overlaid on the H2 column density map obtained from Herschel data (the same as in Figure 1). The white dashed lines indicate the boundaries of the subregions we analyze in steps of 0.2 pc. Top right, bottom right, and bottom left: centroid velocities as a function of position along the arc, from west (0 pc) to north (2.5 pc), within the region between two radial distances from the hub center. The two radial distances are given in the upper left corners of each panel. The green vertical line indicates the position of the prestellar core located in F1.
Other Images in This Article
Copyright and Terms & Conditions
© 2026. The Author(s). Published by the American Astronomical Society.
Copyright ©
2026 Astronomy Image Explorer. All Rights Reserved.