Image Details
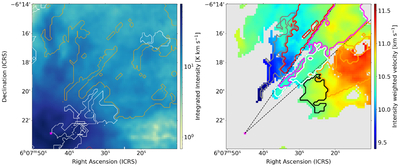
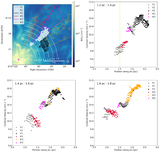
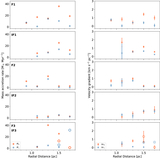
Caption: Figure 7.
Left: map of the 13CO integrated intensity integrated over velocities from 8 km s−1 to 13 km s−1. The white and orange contours show velocity-coherent components of 13CO emission with sizes larger than three beam sizes and the largest component, respectively. Right: map of the intensity-weighted velocity of 13CO in the orange contours of the left panel. The colored contours represents the Fs and IFs as shown in Figure 6. The two black dashed lines indicate position angles of 42∘ and 55∘, from west to north, which correspond to the criteria for separating between IF1, IF2, and IF3 (see Section 3.1).
Other Images in This Article
Copyright and Terms & Conditions
© 2026. The Author(s). Published by the American Astronomical Society.
Copyright ©
2026 Astronomy Image Explorer. All Rights Reserved.