Image Details
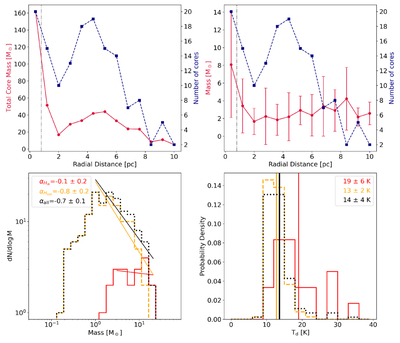
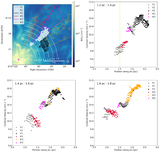
Caption: Figure 4.
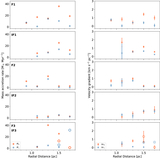
The total (red line in the upper left panel) and the mean (red line in the upper right panel) core mass as a function of the radial distance from IRS 1 in steps of 0.8 pc. The blue lines in both panels indicate the number of cores as a function of the radial distance. The error bars in the right panel indicate the standard deviation of the core mass within the 0.8 pc bin used to derive the mean core mass. The gray vertical lines mark a radial distance of 0.8 pc of the hub size in both panels. Lower left: CMF in Mon R2 from the Herschel catalog of T. S. M. Rayner et al. (2017). The black dashed line shows the CMF for the 148 prestellar cores. The red and orange lines indicate the CMF within and outside the hub of Mon R2 (20 cores in the hub and 128 cores outside the hub). We used the same boundary for the hub region as M. S. N. Kumar et al. (2022). They determined the hub region as the region interior to 0.8 pc from the central star shown in Figure 6. The power-law fitting parameters are written in the upper right corner. Lower right: distribution of dust temperatures of cores inside and outside the hub (red and orange lines). The black dotted line indicates the distribution of the dust temperatures for all the cores. The vertical lines correspond to the mean values, which are given in the upper right of the panel.
Other Images in This Article
Copyright and Terms & Conditions
© 2026. The Author(s). Published by the American Astronomical Society.